April 19, 2003
The IS/LM Model
Here we derive the IS and LM curves and illustrate fiscal and monetary policy.
(This lecture was originally presented on April 3rd.)
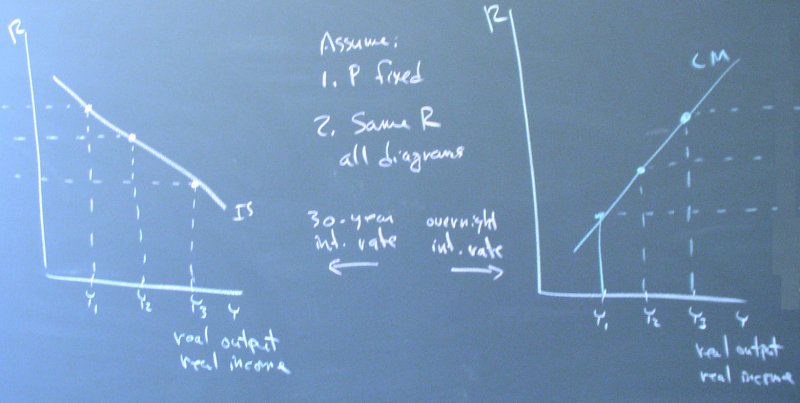
The two key assumptions are that there is one interest rate in both the loanable funds market and the money market and that the price level is fixed. The first assumption is relaxed in the next lecture. Our discussion of the expectations hypothesis, risk premia, and the yield curve has already explored the value of the second assumption as a useful approximation.
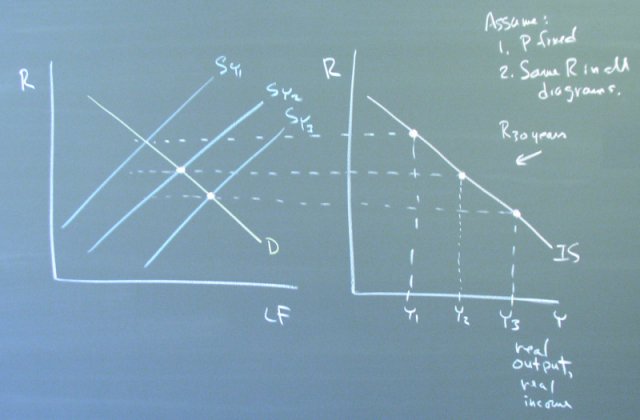
Deriving the IS curve by considering three levels of income.
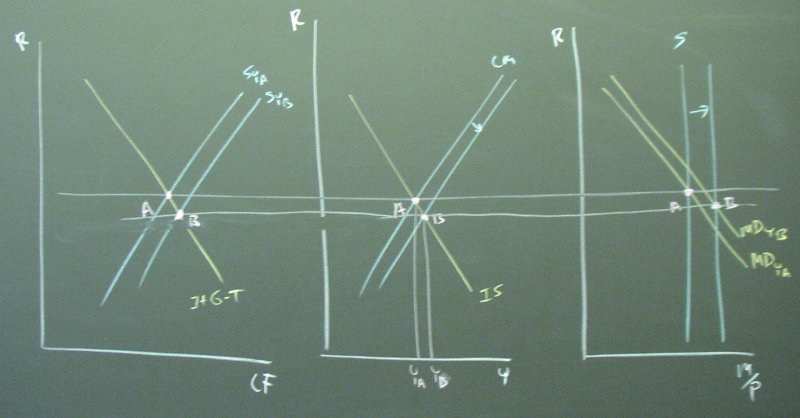
Changes in government spending or taxes or autonomous changes in investment shift the IS curve.
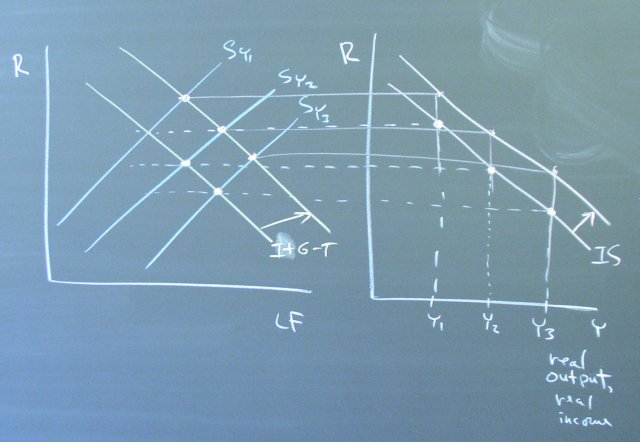
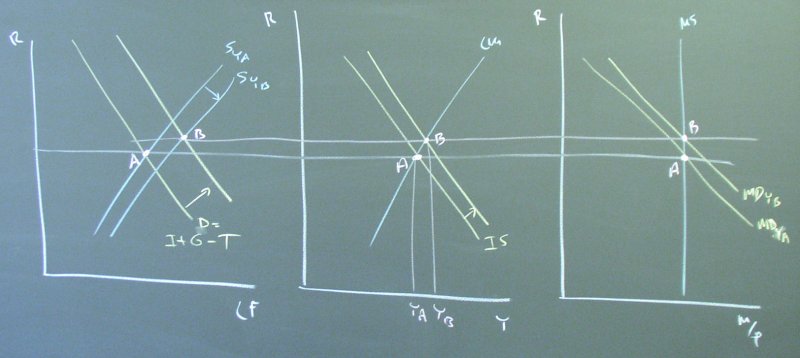
Including all three diagrams in an analysis of fiscal policy shows how the change in income causes the supply of loanable funds and the demand for money to align with the equilibrium interest rate.
A similar consideration of three levels of income leads to the LM curve.
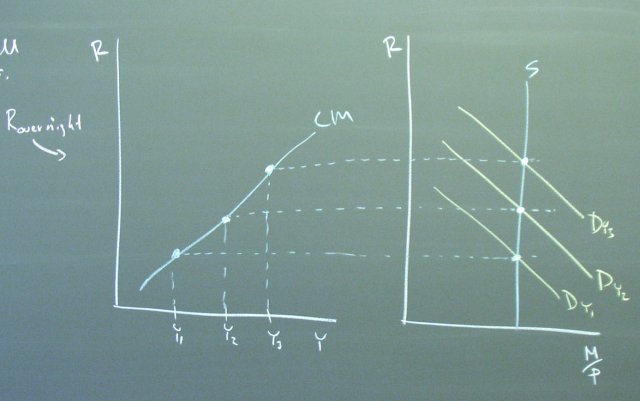
Changes in the money supply shift the LM curve.
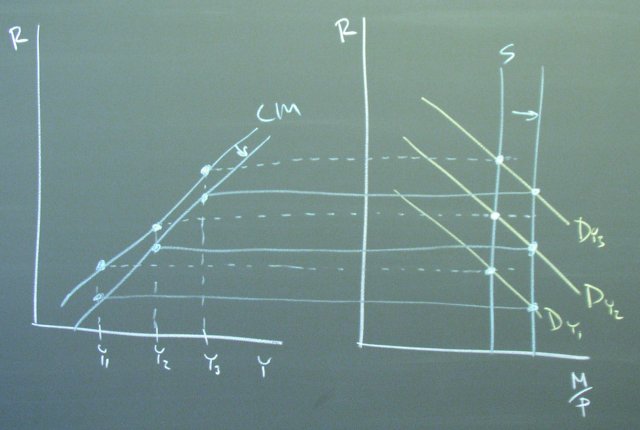
Including all three diagrams shows how the supply of loanable funds and the demand for money shift to line up with the new equilibrium interest rate.
Keep in mind that putting the IS and LM curves on the same graph only makes sense if we have the same interest rate for both curves. Does our analysis of the yield curve support this simplification?