April 25, 2003
Last Day of Class
Once more, with feeling:
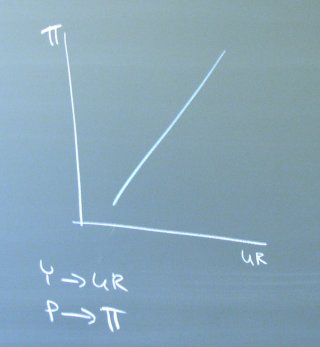
The implications of the Classical Model for the Phillips curve follow from an analysis of how technology shocks (or something similar) affect the production function and the marginal product of labor.
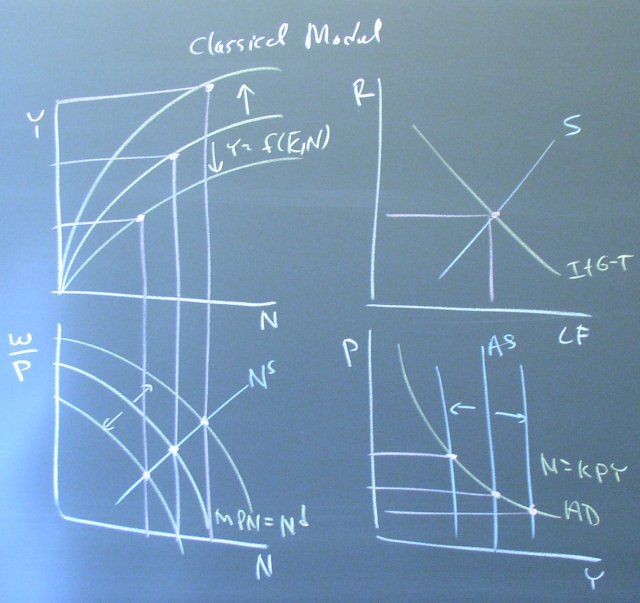
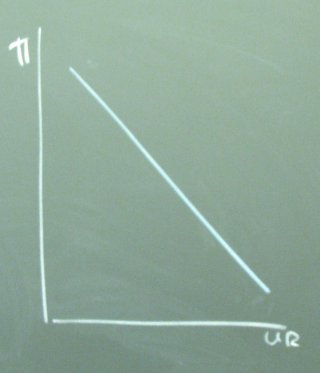
If we relax the formal implication of the model that there is no unemployment (and the Phillips curve is a vertical line on the vertical axis), we get an upward sloping Phillips curve. We have to generalize to the notion that a certain amount of unemployment occurs as people change jobs, and the extent of that unemployment depends on how large Y is. Basically, it might take longer to find a suitable job when Y is low.
The Keynesian Model treats business cycles as movements in the aggregate demand curve. The cause might be changes in I+G-T.
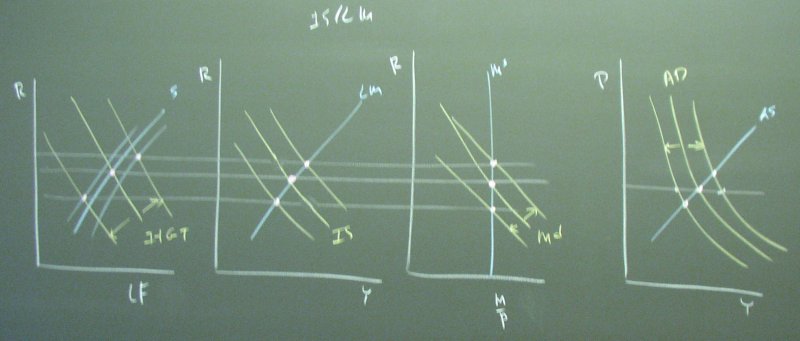
The changes also might be changes in M.
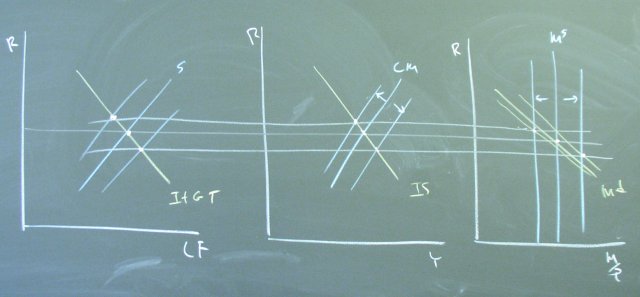
The AS/AD diagram would be the same as it is for I+G-T shifts. To understand the shifts in the aggregate demand curve, it helps to think about what happens if you change M and hold P fixed.
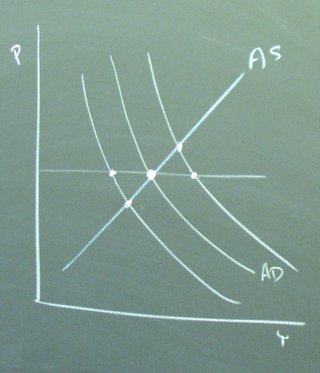
Both kinds of business cycles imply a downward sloping Phillips curve.
Study question: Get out your Phillips curve handout. Which model is supported by the Phillips curve data for 1948-1969? How might one account for the 1970's?
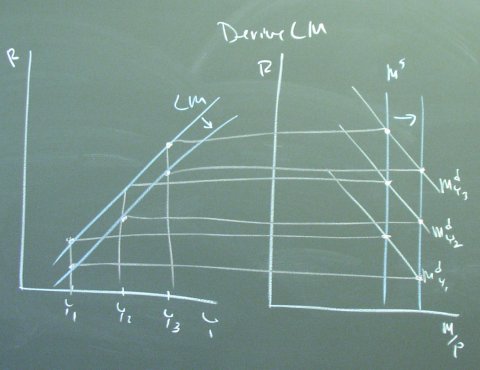
Derive the LM curve and show how changes in M cause it to shift.
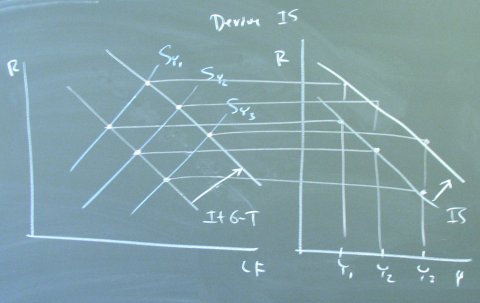
Derive the IS curve and show how changes in G-T (or shifts in the investment schedule) cause it to shift.
And now, a fundamental question.