November 12, 2003
Stata 4 - Confidence Intervals and Hypothesis Tests
For this exercise we will use the data from Stata 3. In all cases, we will assume that the data in the averages are independent, which might well be an assumption to question in a more sophisticated analysis.
Due: 11/25.
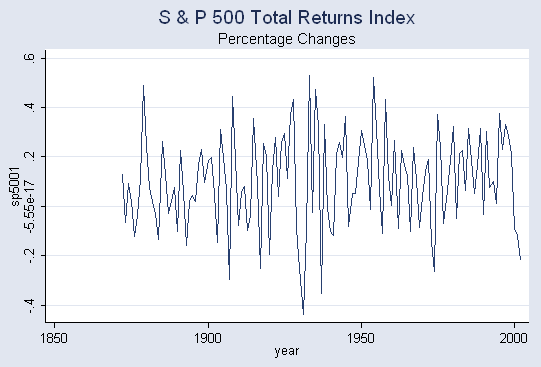
1. Using all the data, calculate a 95% confidence interval for the expected value of the percentage change in the S & P 500 total return index. Calculatie 95% confidence intervals for the periods 1871-1919, 1920-1929, 1930-1949, and 1950-2002.
2. Test (at a 5% level) the null hypothesis that the expected values in #1 are equal for each pair of adjoining subsamples. (This will be 3 tests.) Calculate 95% confidence intervals for the differences in expected values.
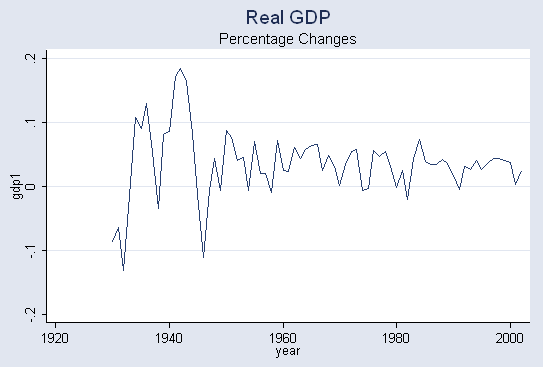
3. Form confidence intervals for the expected value of real GDP percentage growth using the data before 1950 and the data after 1950.
4. Test (at a 5% level) the null hypothesis that the expected values for the two periods in #3 are equal. Calculate a 95% confidence interval for the difference in expected values.
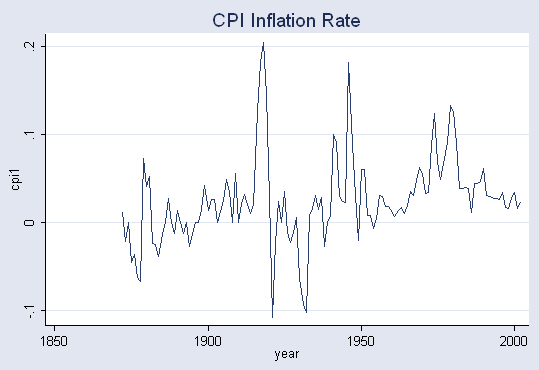
5. Calculate 95% confidence intervals for the expected value of the CPI inflation rate for the periods 1950-1969 and 1970-1999.
6. Test (at a 5% level) the null hypothesis that the expected inflation rates in #5 are equal. Calculate a 95% confidence interval for the difference in expected values.