October 30, 2003
Estimation & the Central Limit Theorem
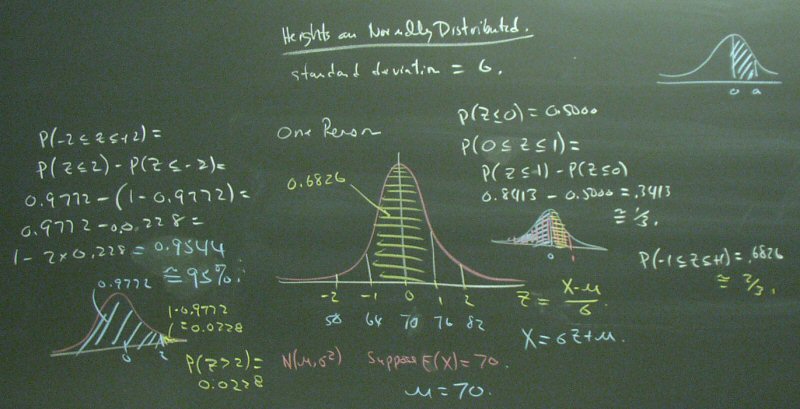
The Central Limit Theorem provides the tool we need for Estimation, Confidence Intervals, and Hypothesis Testing. We will make several trips through this material. Today, we being with "Heights of People."
Start by calculating some normal distribution probabilities.
We started the semester trying to find the value of theta, but here we are focusing on mu. On the left, we see that using the average of two observations yields a lower variance than using a single observation. On the right, we generalize this result to n observations.
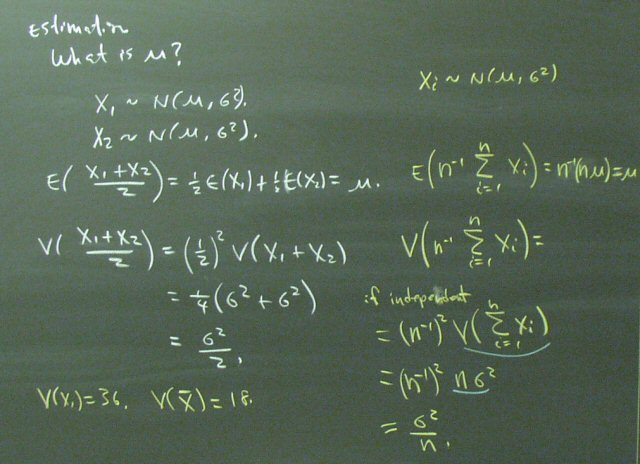
This analysis is the core of the Central Limit Theorem.

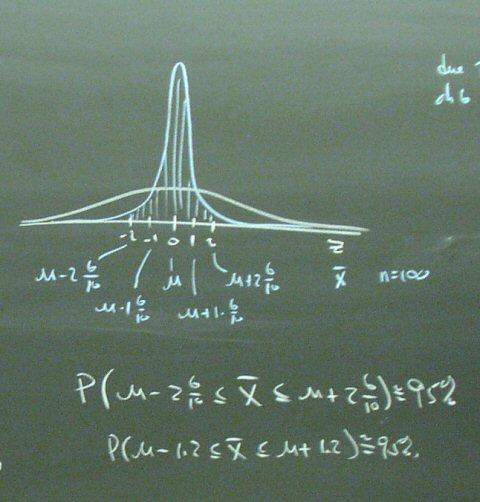
Using 100 observations would get the standard deviation of the average down to 6/10 inch. The sample mean would be within 1.2 inches of the population mean about 95% of the time.
The same analysis applies to reducing investment risk by diversifying. We must, of course, recognize that the entire analysis presumes that mu is constant. In the real world, the mean for all stocks might be varying in response to economic conditions. We must also recognize that stocks (Ford and GM, for example) are not likely to always be independent.