March 04, 2003
Statistics
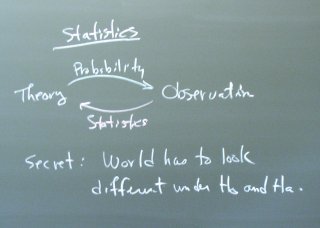
The fundamental basis for statistics is probability theory, which tells us how the world would look if we knew the true theory. In doing statistical inference, we observe the world and try to understand what our observations tell us about the theory. This analysis is only possible if probability theory tells us that the world will look somehow different under different hypotheses.
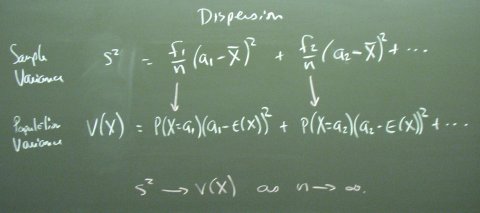
We need means and variances so we might as well jump in. There are two kinds of these things: population and sample. The population numbers are for the underlying true theory. The sample numbers are what we observe.
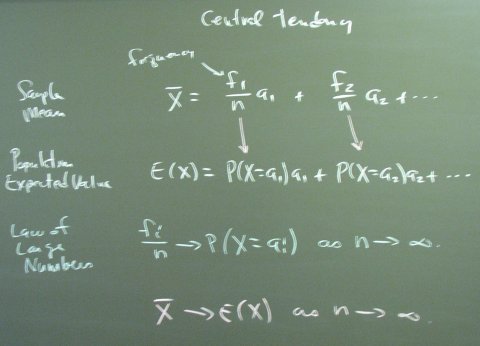
The law of large numbers says that relative frequencies converge to probabilities in large samples. In a sense, this is the definition of probability. The definition of a probability of one-half is what happens when you toss a fair coin a million times. This is, of course, circular because it is also the definition of what we mean by a fair coin.
The law of large numbers and the central limit theorem are the two big results driving statistics. The CLT allows us to infer the variance of the sample mean even though we only observe one sample mean. (It would take several sample means to allow a direct calculation of the sample variance of the sample means.)
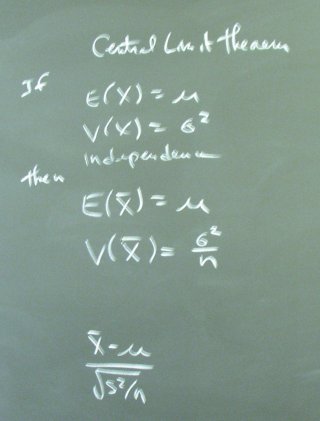
In passing, we noted that the CLT also shows us that a diverse portfolio that averages over many securities will have a smaller variance than a portfolio with a single security.
Finally, we compared the mean-variance valuation of expected return and risk to the utility-based valuation of risk by looking at a couple of examples from the handout.