March 06, 2003
Risk vs. Expected Return
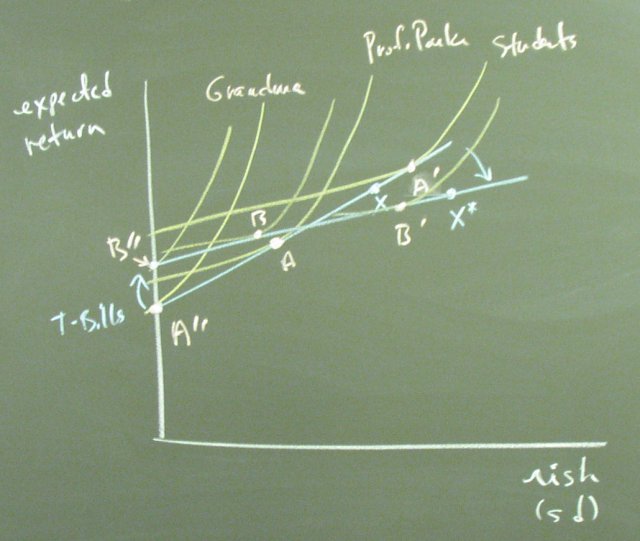
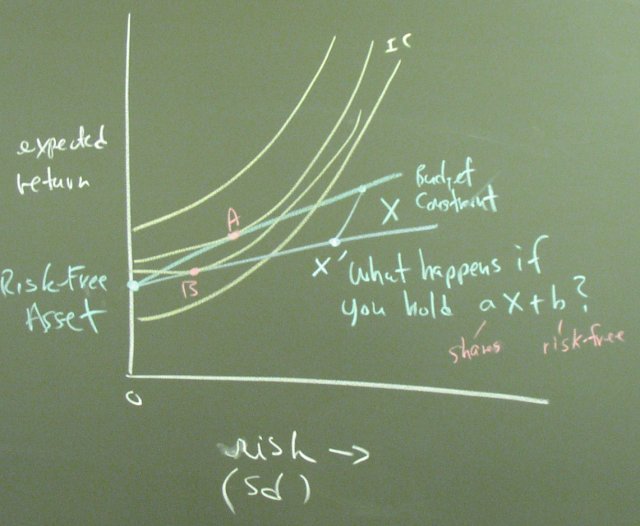
We will use the basic ideas of the two goods - two prices diagram to study how people allocate their resources between two assets, one risk-free and one risky.
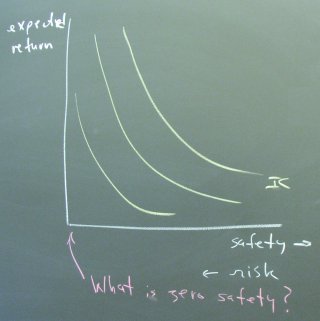
The diagram we will use has indifference curves that are a mirror image of the normal case because we would have trouble with a diagram that depended on "zero safety" at the origin. In the two goods - two prices setting, risk is like garbage. People want less of it and pay to have it removed.
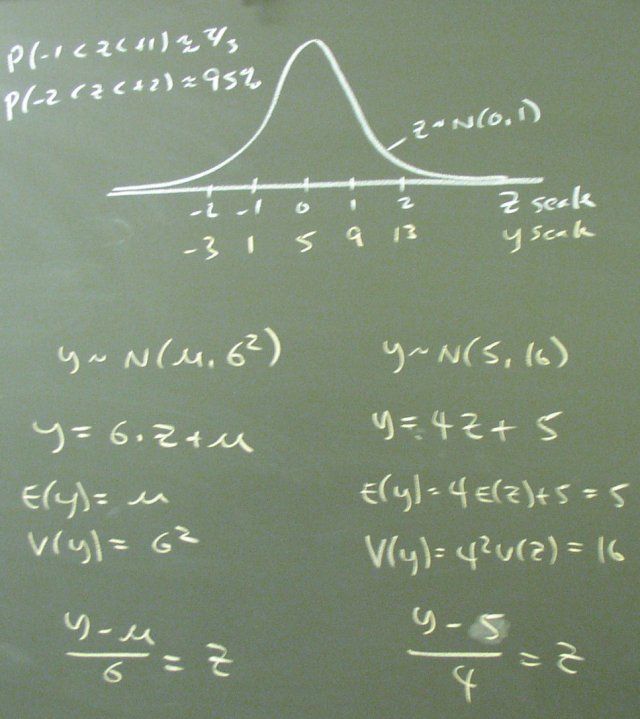
The budget constraint arises from statistical concepts.
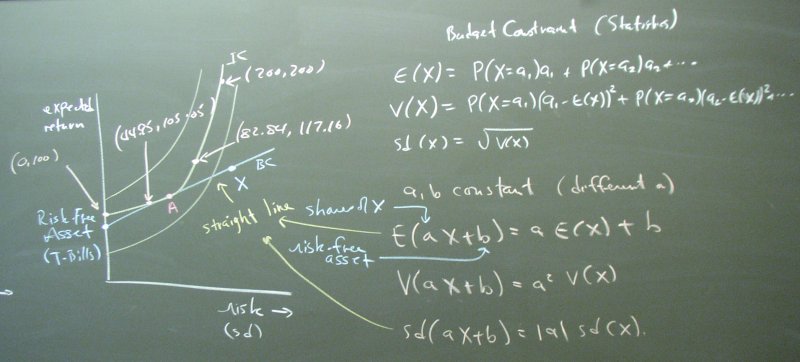
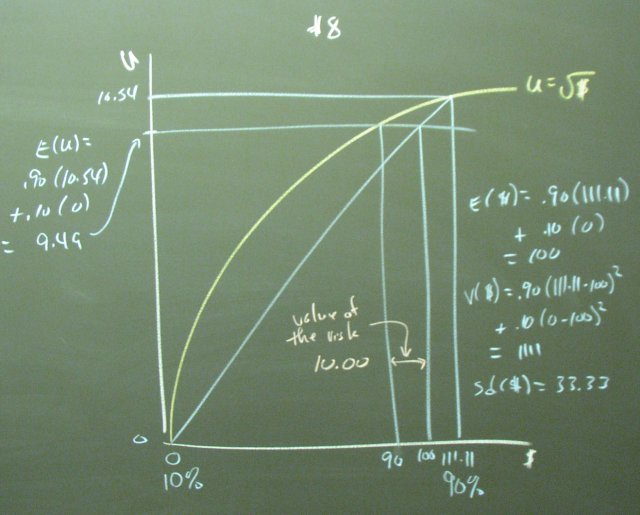
Notice the numerical labels on the one indifference curve. These tie in the utility-based analysis below.
The statistical concepts are familiar from Econ 70's use of the standard normal table in the back of the book.
The second panel in the handout (page 3) shows a utility-based valuation of risk where the probability of the good outcome is 90%.
#6 shows how the risk has little value (0.03) if the good and bad outcomes are not spread far apart.
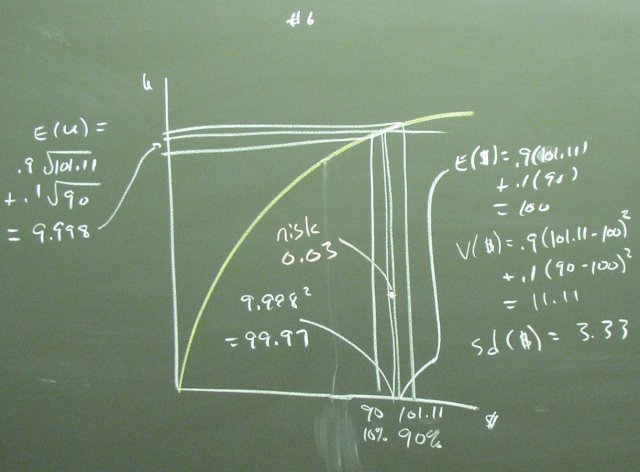
If you had two outcomes for your career outcome, 90k and 101k, would you think the risk was large?
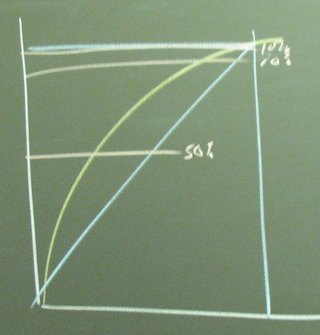
The third panel shows that as the probability of the bad outcome approaches zero and you get into the "corner", the curvature of the utility function becomes less important and the risk becomes less valuable.
We concluded by noting two features of our new diagram. First, different people with different utility functions will have different indifference curves and, hence, different optimal portfolios. Second, every day the budget constraint moves around and people have to adjust their portfolios. This causes trading. Without this movement, there would be no reason (except for commissions!) for Wall Street to do so much trading.