October 30, 2003
Mean-Variance Analysis
Step 1 is to construct indifference curves from our utility-based valuation of risk.
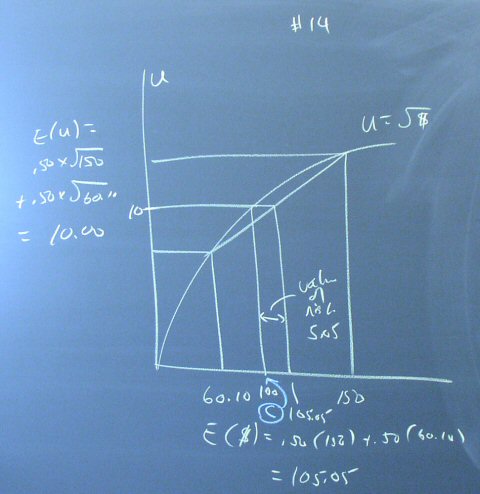
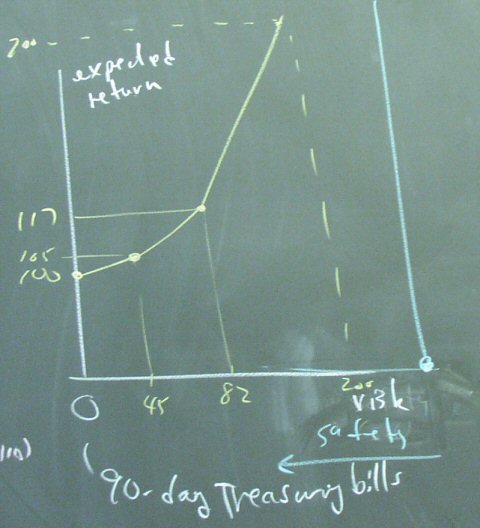
The fourth panel on the handout can be expressed as:
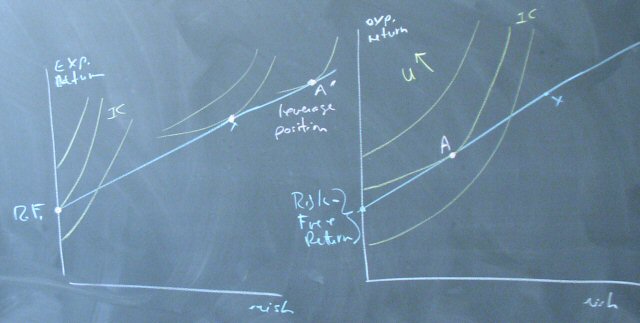
We use some basic results from statistics to construct the agent's budget constraint.

Putting this all together we have a diagram showing the optimal portfolio.
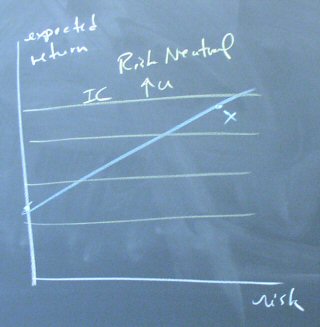
A risk-neutral agent does not fit this analysis. His indifference curves are horizontal lines.
Posted by bparke at 12:04 PM