September 09, 2003
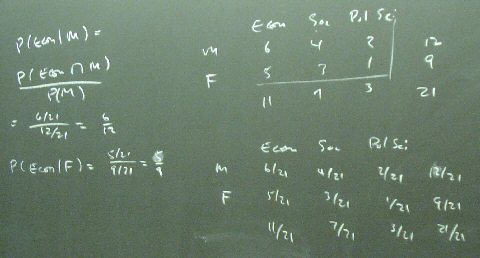
Tables
Sometimes a table is the most convenient way to describe the sample space.
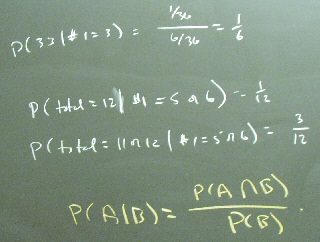
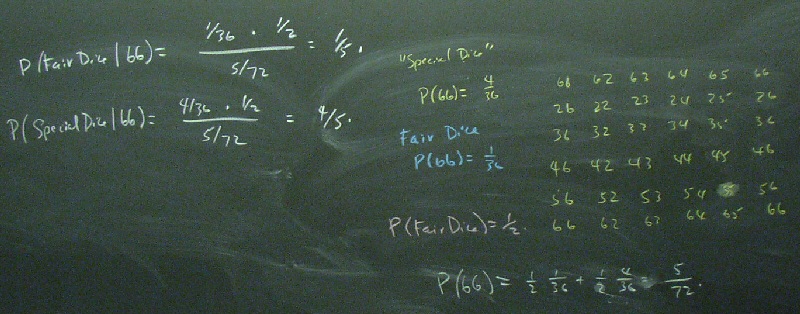
Rolling Dice
Rolling two dice is an example of an experiment where listing the complete sample space works well.
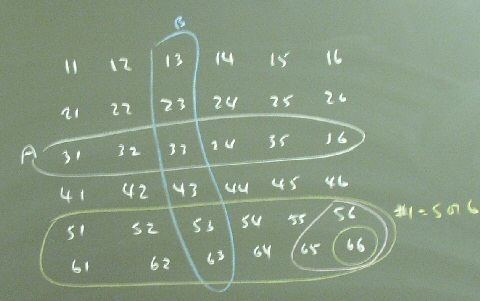
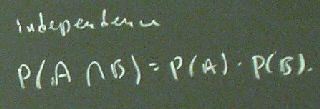
Two dice are physically and statistically independent.
Some probabilities found by studying the diagram:
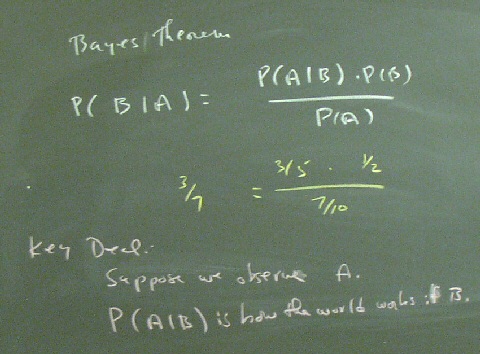
Bayes' Theorem
Bayes' Theorem is an elegant application of a Venn diagram.
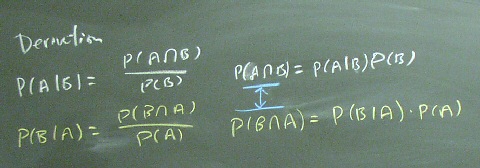
The proof is algebraic.
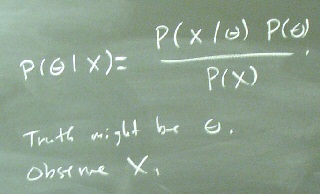
Bayesian statistical analysis uses Bayes' Theorem to think about theta.
Using Bayes' Theorem to consider the implications of observing two sixes when the dice might be fair or they might have two sixes on each die.
The practical problem with applying Bayesian analysis in economics is that we do not have a good source for the prior probabilities about theta. What is the probability that Keynes was right?
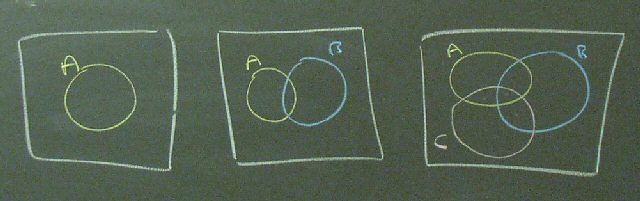
Venn Diagrams and Other Representations
A venn Diagram has four pieces of information, and knowing any three allows you to solve for the fourth because the areas add up to one.
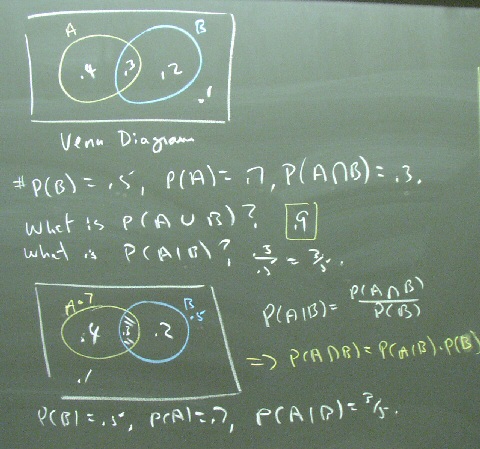
A complete list of possible Venn diagrams: