June 18, 2003
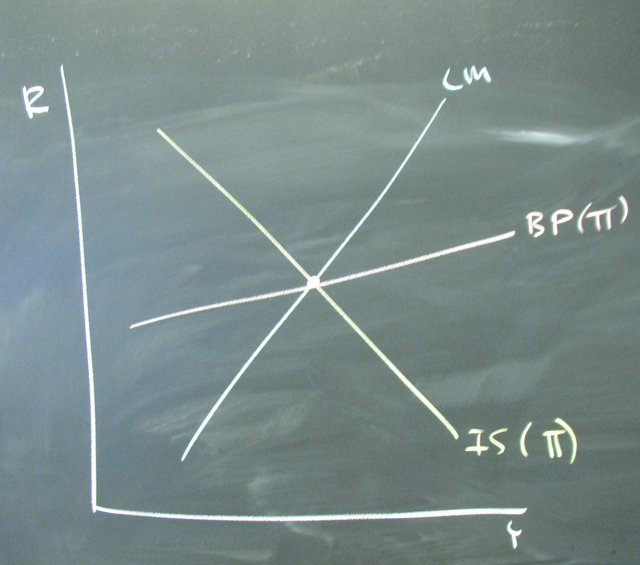
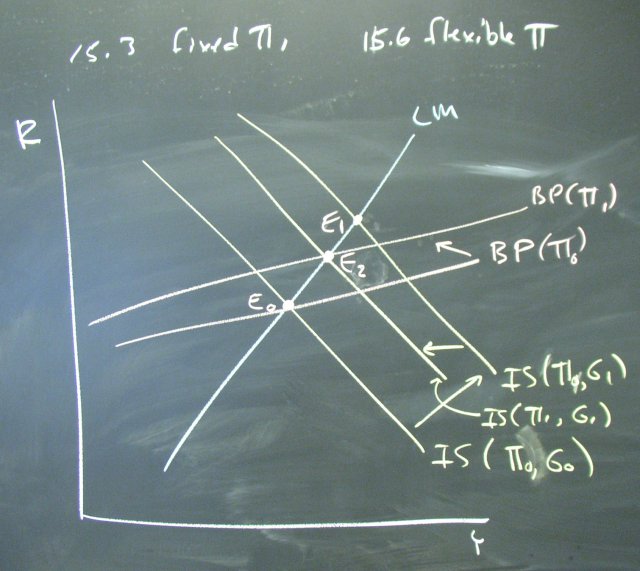
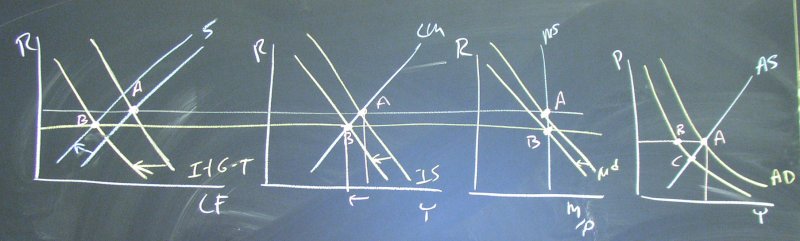
The Mundell-Fleming Model
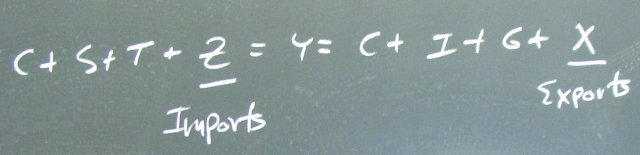
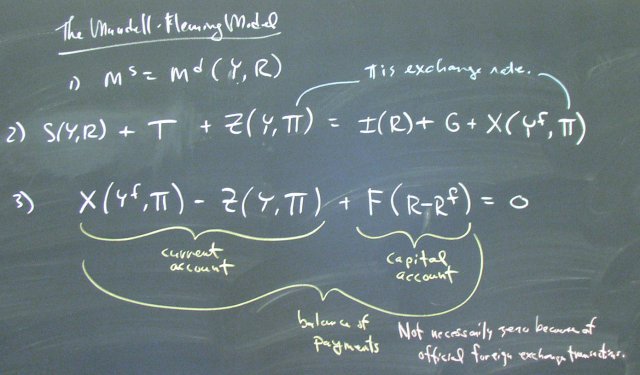
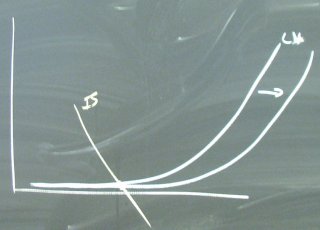
Thinking about how the exchange rate affects imports and exports:

June 13, 2003

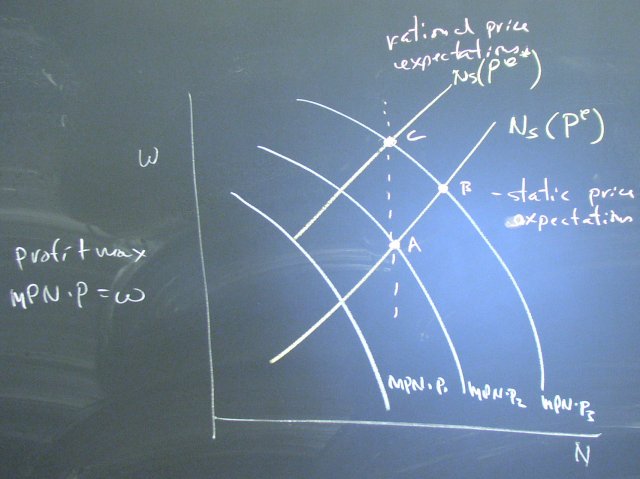
Rational Expectations
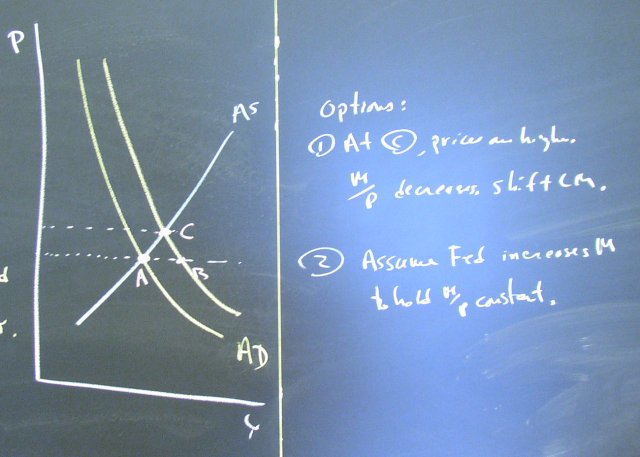
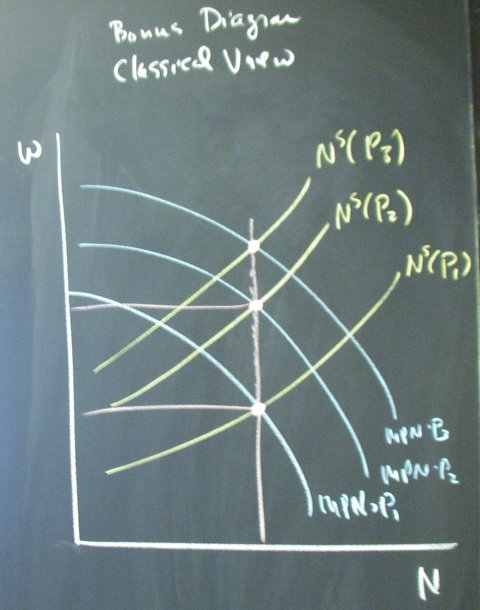
Shifting the labor demand curve by changing prices can increase labor hired and output if workers base the labor supply curve on price expectations that do not adjust rapidly. If works have "rational expectations" and anticipate the need to adjust labor supply in light of the new prices, the equilibrium might not move horizontally at all.
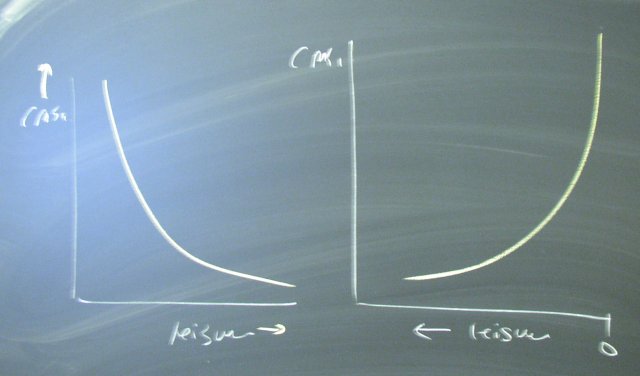
A Real Business Cycles Model
Robinson Crusoe provides a "representative agent" economy with one truly representative agent.
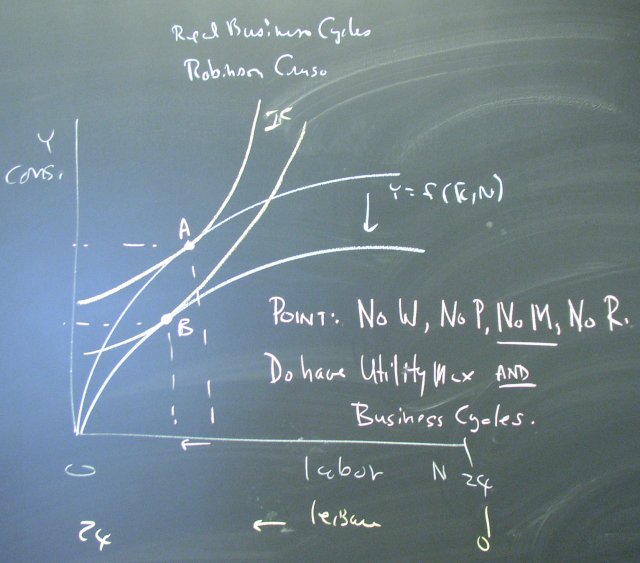
The indifference curves are mirror images of the usual case:
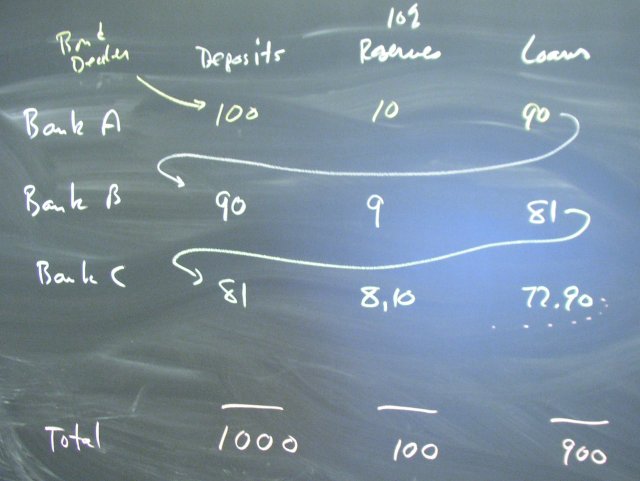
Implementation of Monetary Policy
The central bank actually implements monetary policy by creating new money in the form of computer entries, not in the form of currency.

June 09, 2003
Getting Ready for MT #1
We must be ready:
Would shifting the LM curve work?
June 06, 2003
Discussion of Old Exam Questions
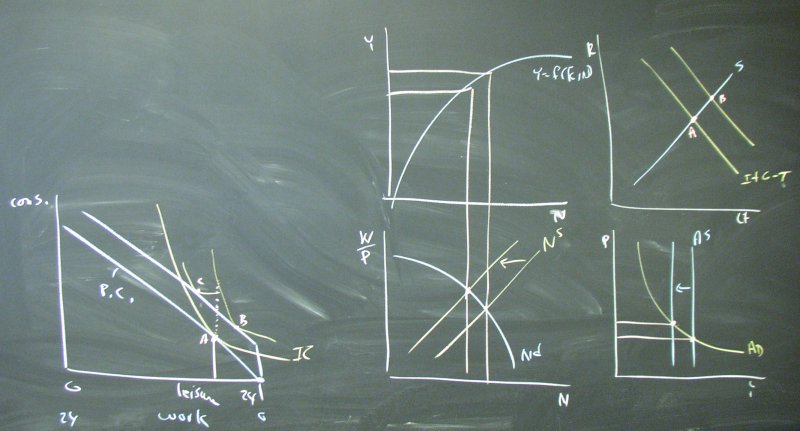
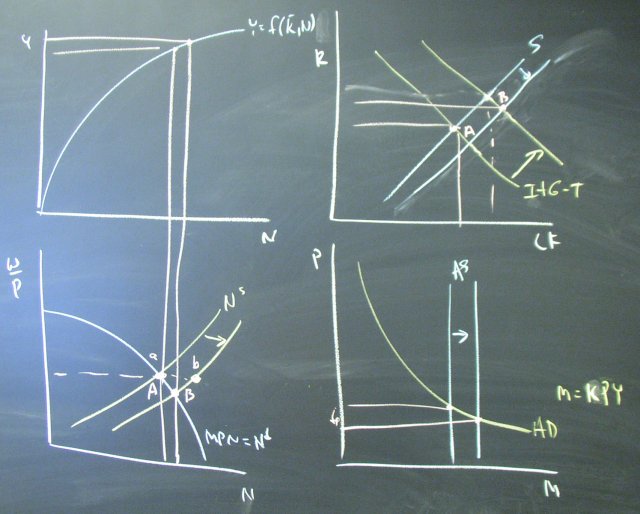
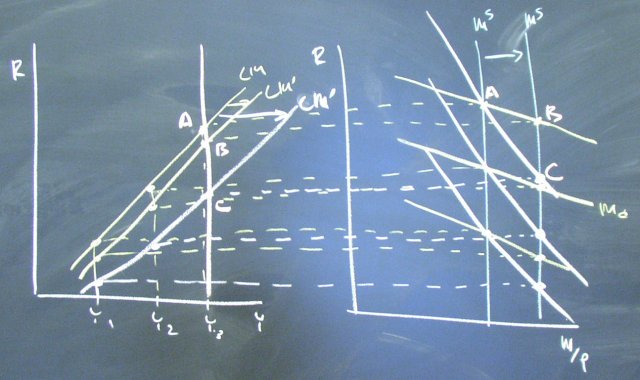
Effects of improved worker productivity on the price level. The lower-left diagram is a review of marginal tax rate cuts vs. lump sum rebates.
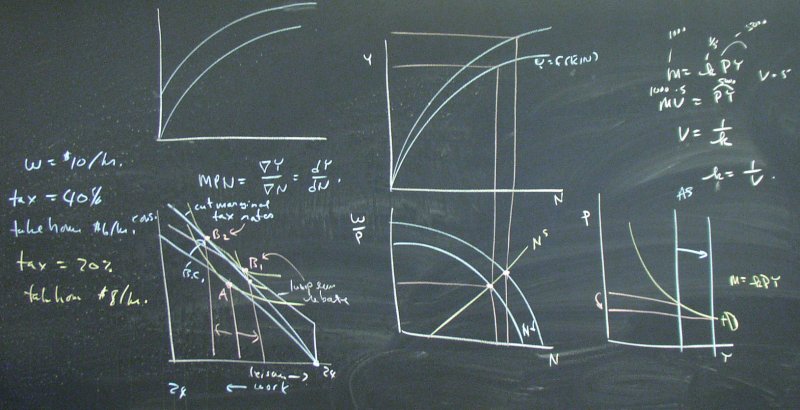
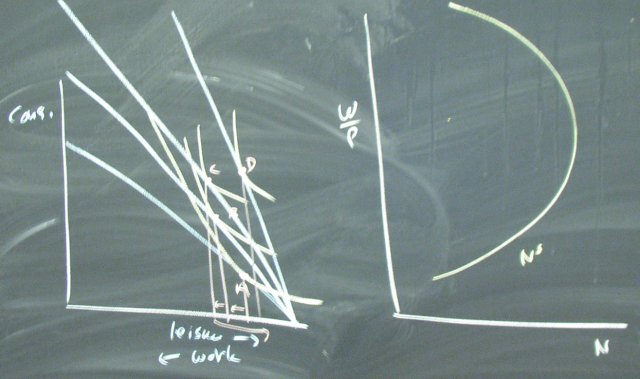
A backward-bending labor supply curve:
Paypal and/or ATMs increase the velocity of money:
How deflation and zero interest rates make it difficult to stimulate the economy by shifting the LM curve.
June 05, 2003
Tax Cuts
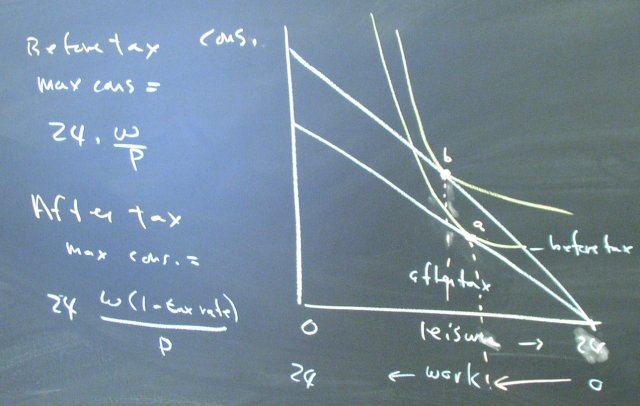
We compared the effects of marginal tax rate cuts and lump sum tax rebates under the Keynesian and Classical views.
At a given wage rate, we expect a cut in the income tax rate to increase labor supply.
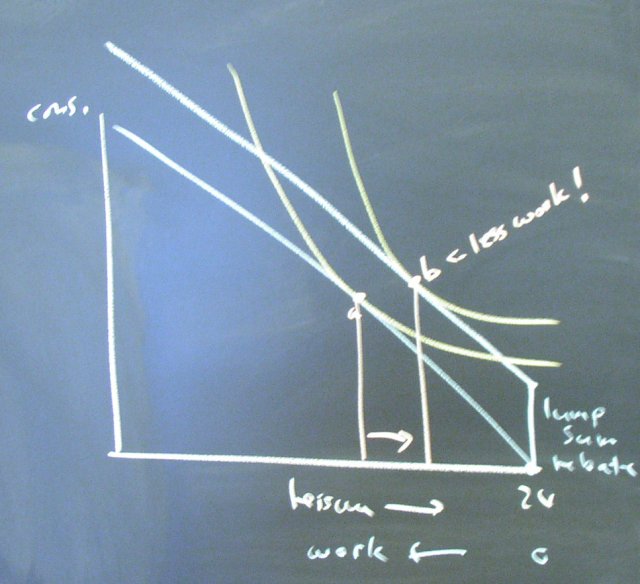
The effect of a lump sum rebate is not as clear. It could increase or decrease the labor supply at a given wage rate.
June 04, 2003
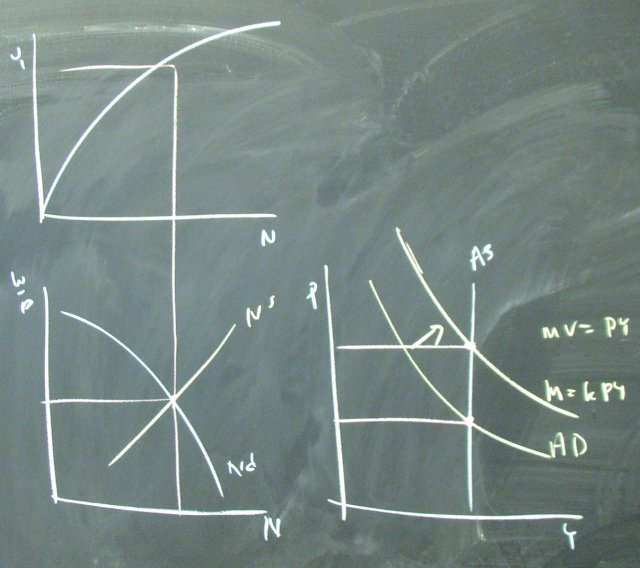
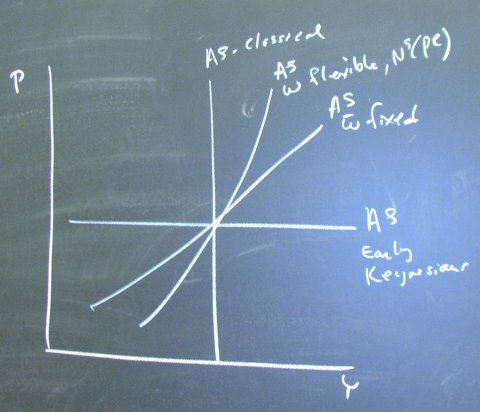
Keynsian Aggregate Supply Curves
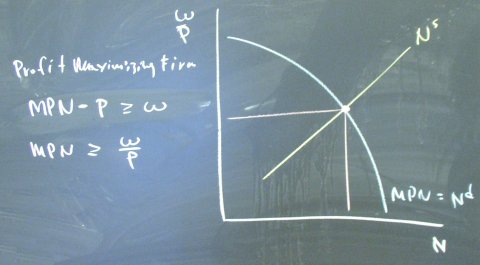
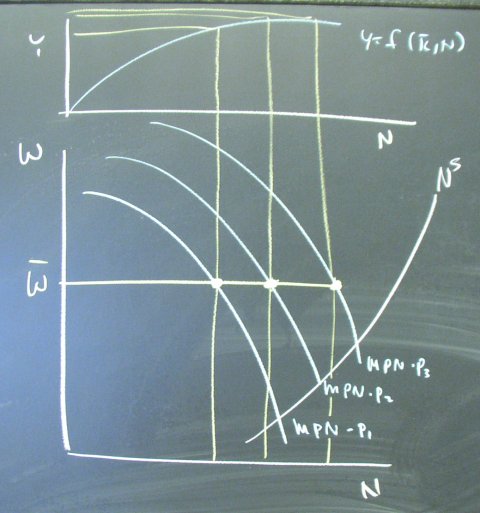
A numerical version of the MPN analysis:

The Classical View:
The fixed wage view:
The flexible W, fixed price expectations (for workers) view:
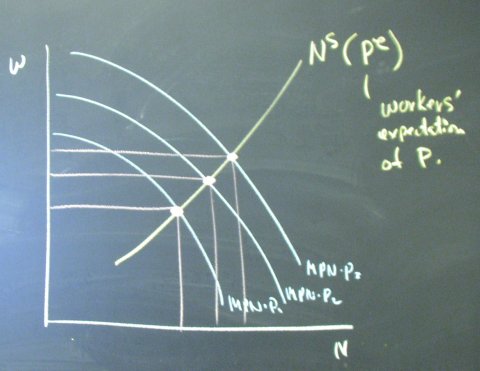
A restatement of the Classical view:

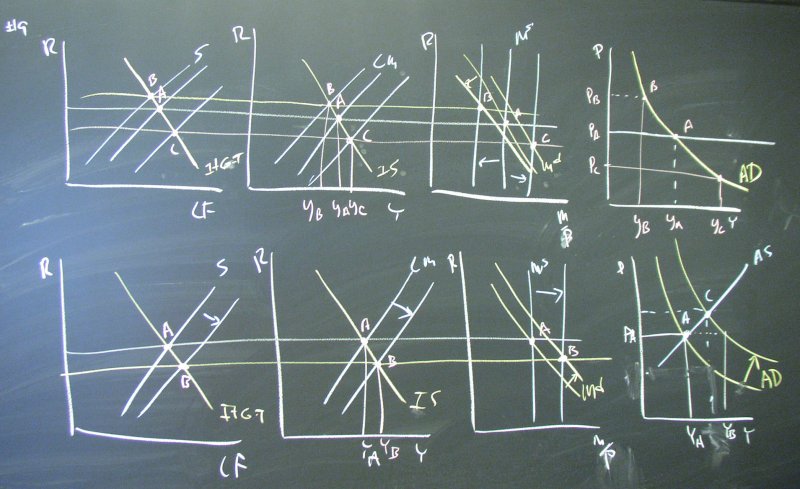
June 03, 2003
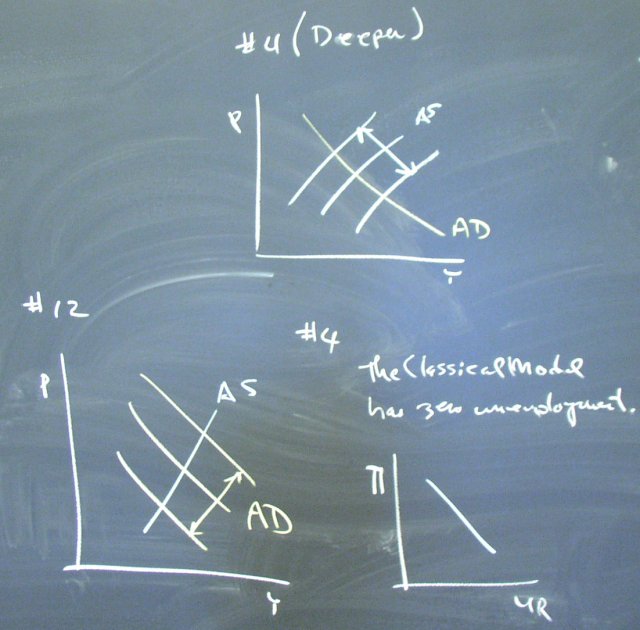
Deep
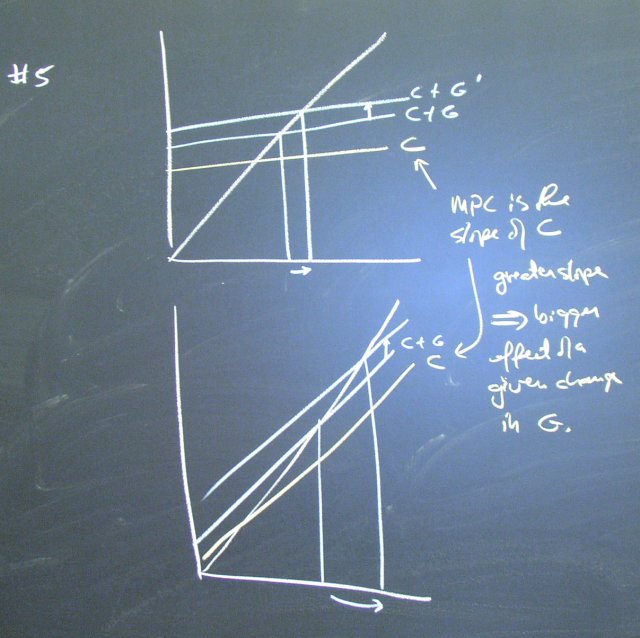
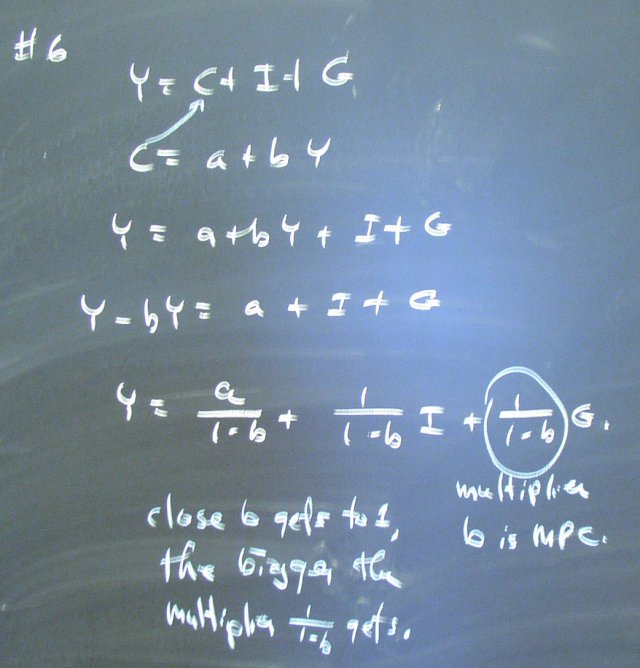
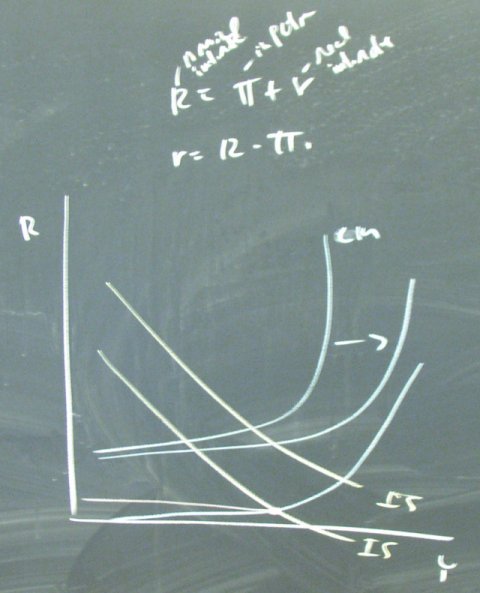
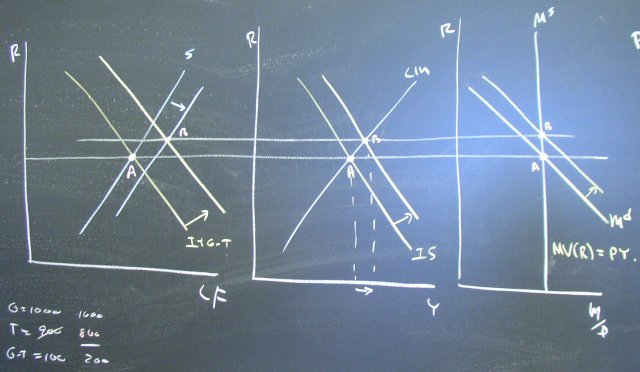
The problem is (i) the slopes of the curves and (ii) how far they shift. The results determine the effectiveness of monetary and fiscal policies.
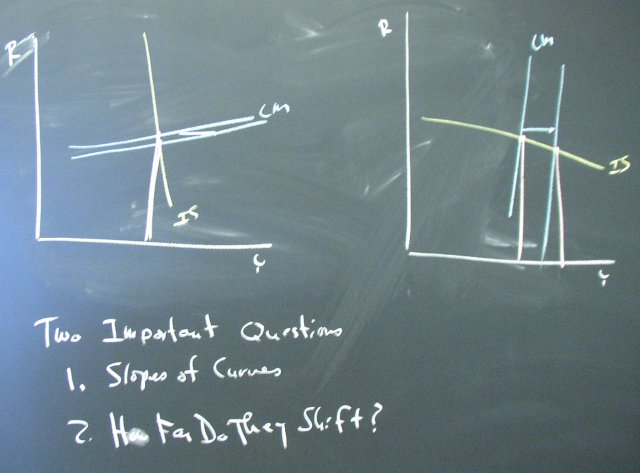
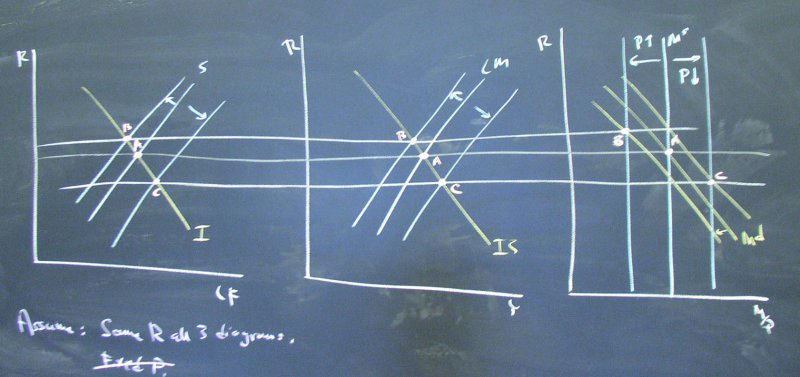
A general view of the issue:

Applied to the IS and LM curves:
The slope of the LM curve depends on how large the changes in money demand caused by income changes
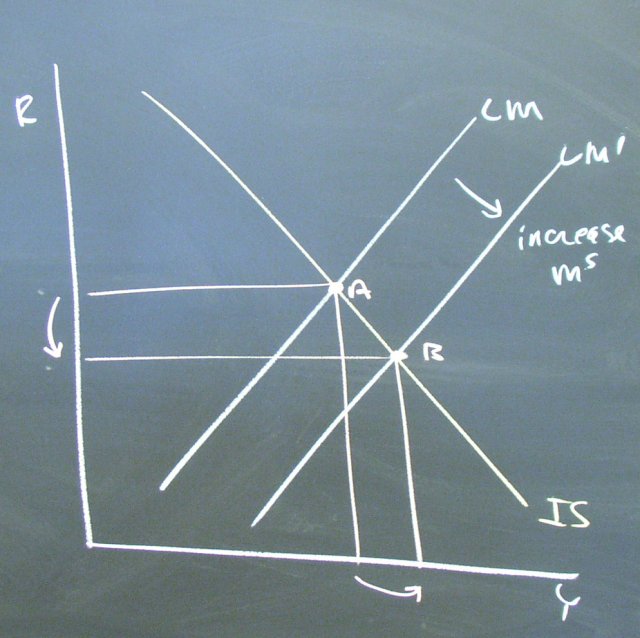
How much the LM curves shifts with an increase in the money supply depends on the interest rate eleasticity of money demand.
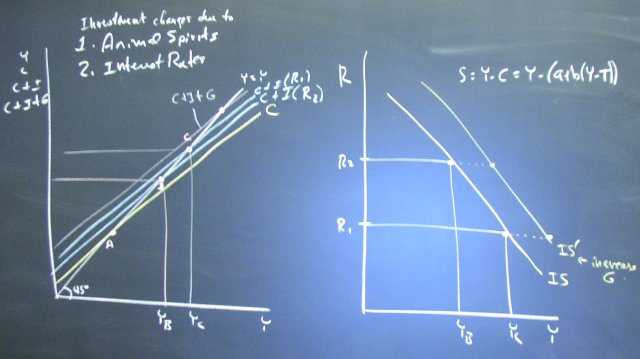
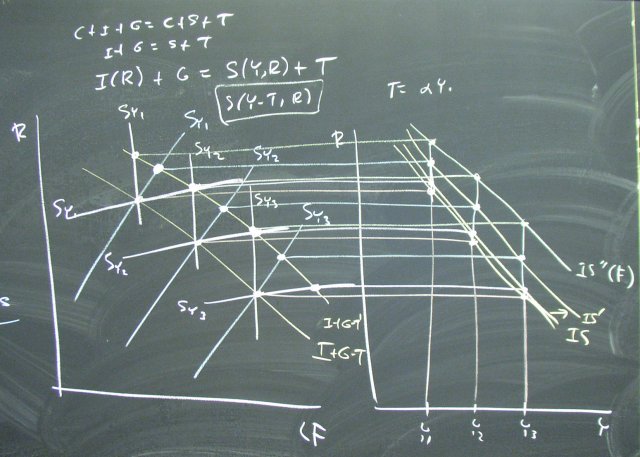
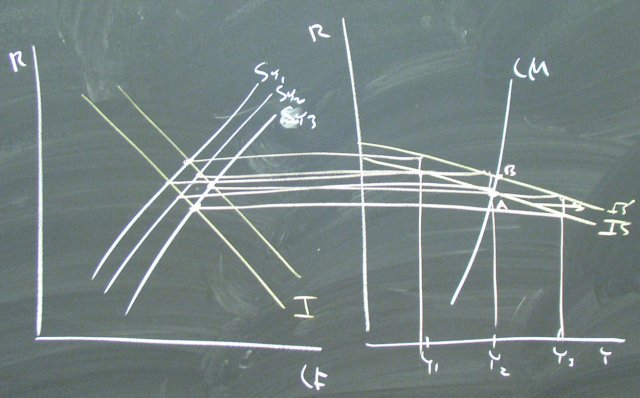
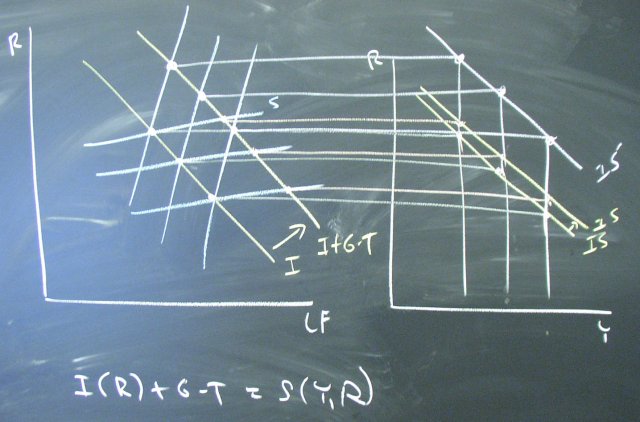
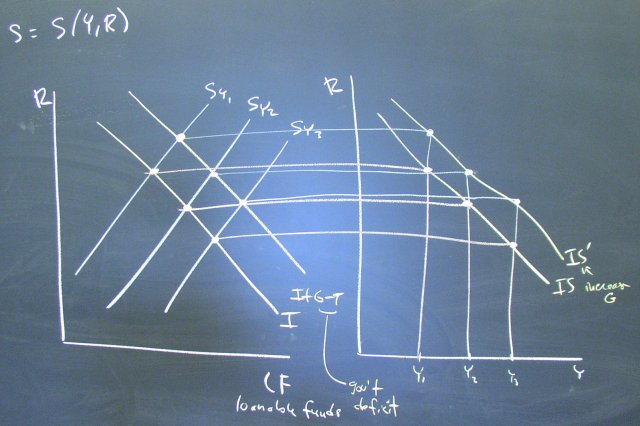
A similar story for the IS curve:
The shift n the IS curve depnds on the slope of the savings function.
June 02, 2003
IS/LM AS/AD
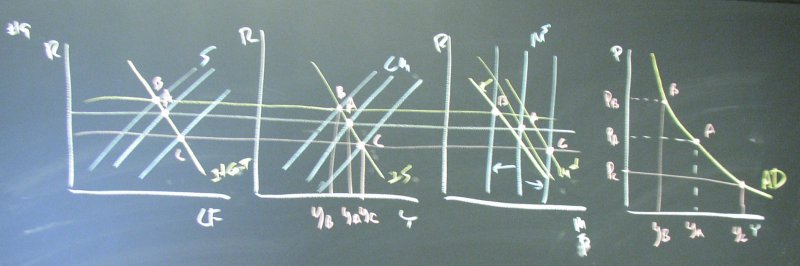
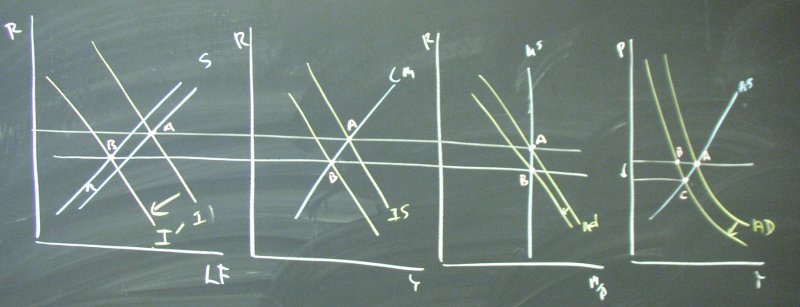
Derive the Aggregate Demand curve by changing P for a fixed money supply:
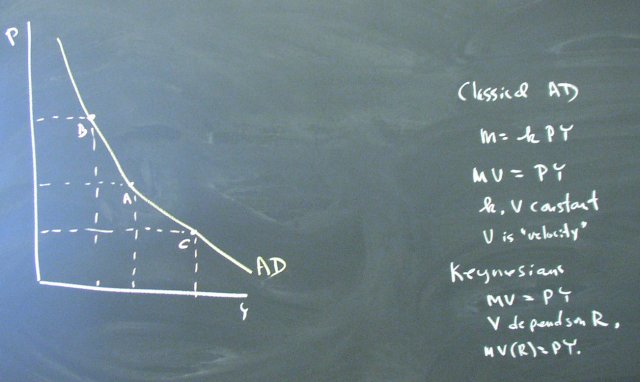
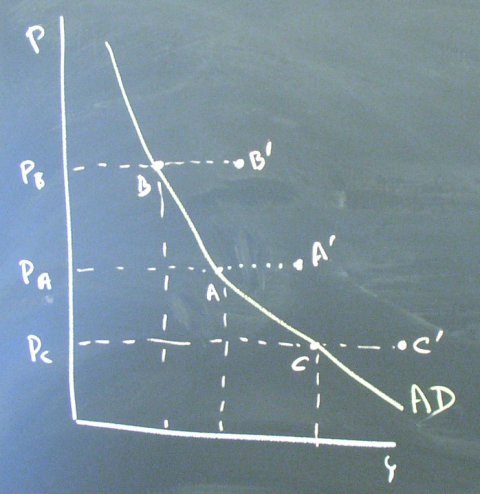
For a given price level, a change in G-T or in M shifts the AD curve:
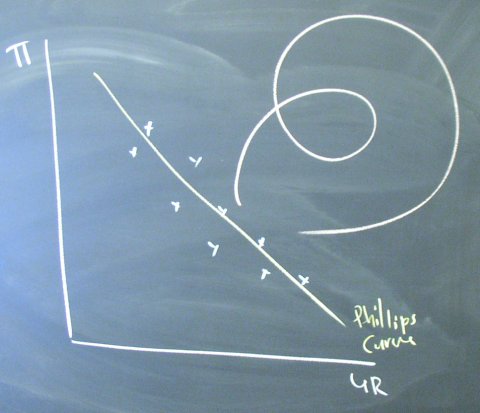
How do we explain this data?
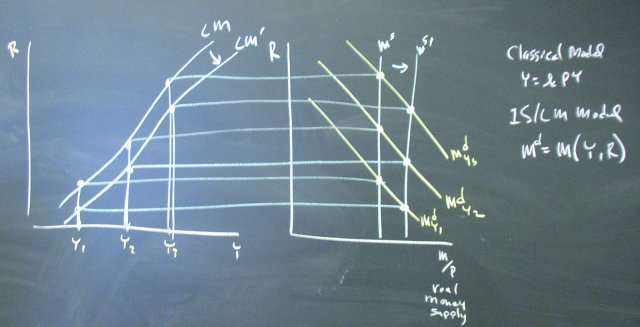
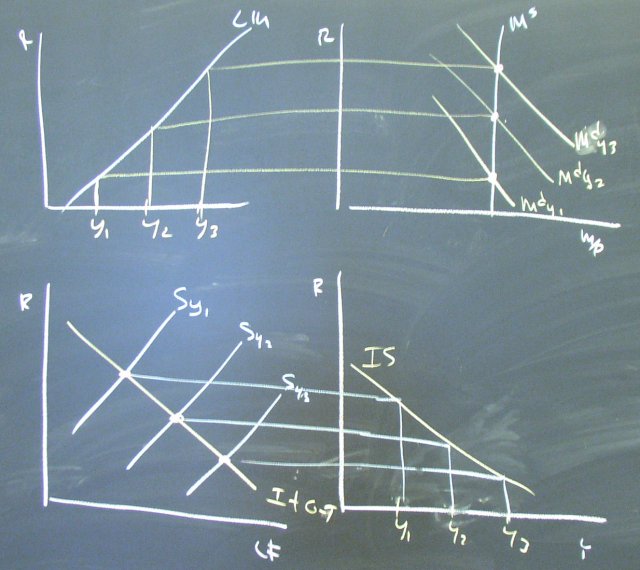
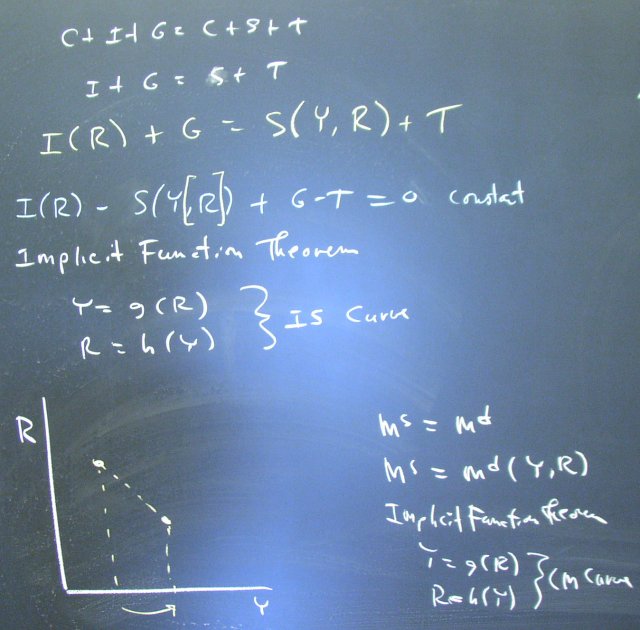
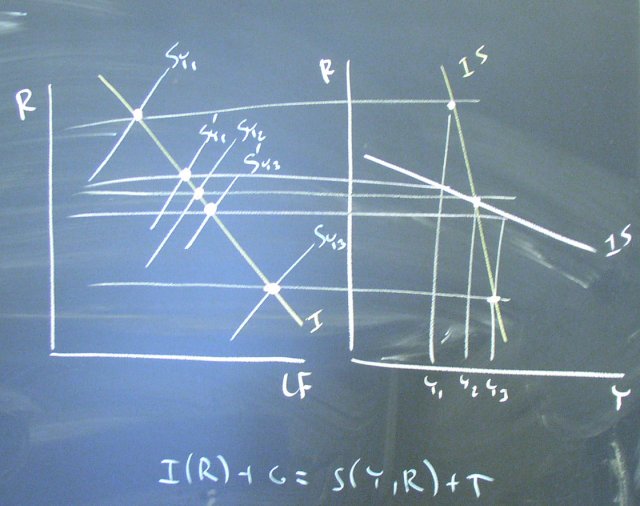
IS/LM
Deriving the IS curve and show how it shifts with changes in G-T:
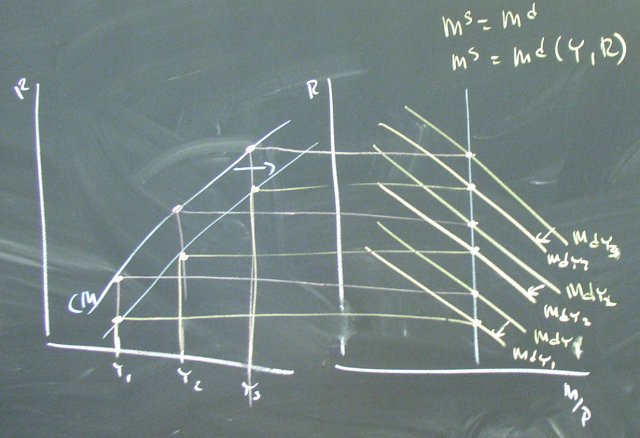
Derive the LM curve and show how it shifts with changes in M.